
Replay the days you traded, one candle at a time
Open any day in your journal and the market plays back minute by minute, with your own trades on the chart. Pause where you got in, see what happened next, and take the trade again with practice orders. The candles you haven't reached stay hidden until the replay gets there.
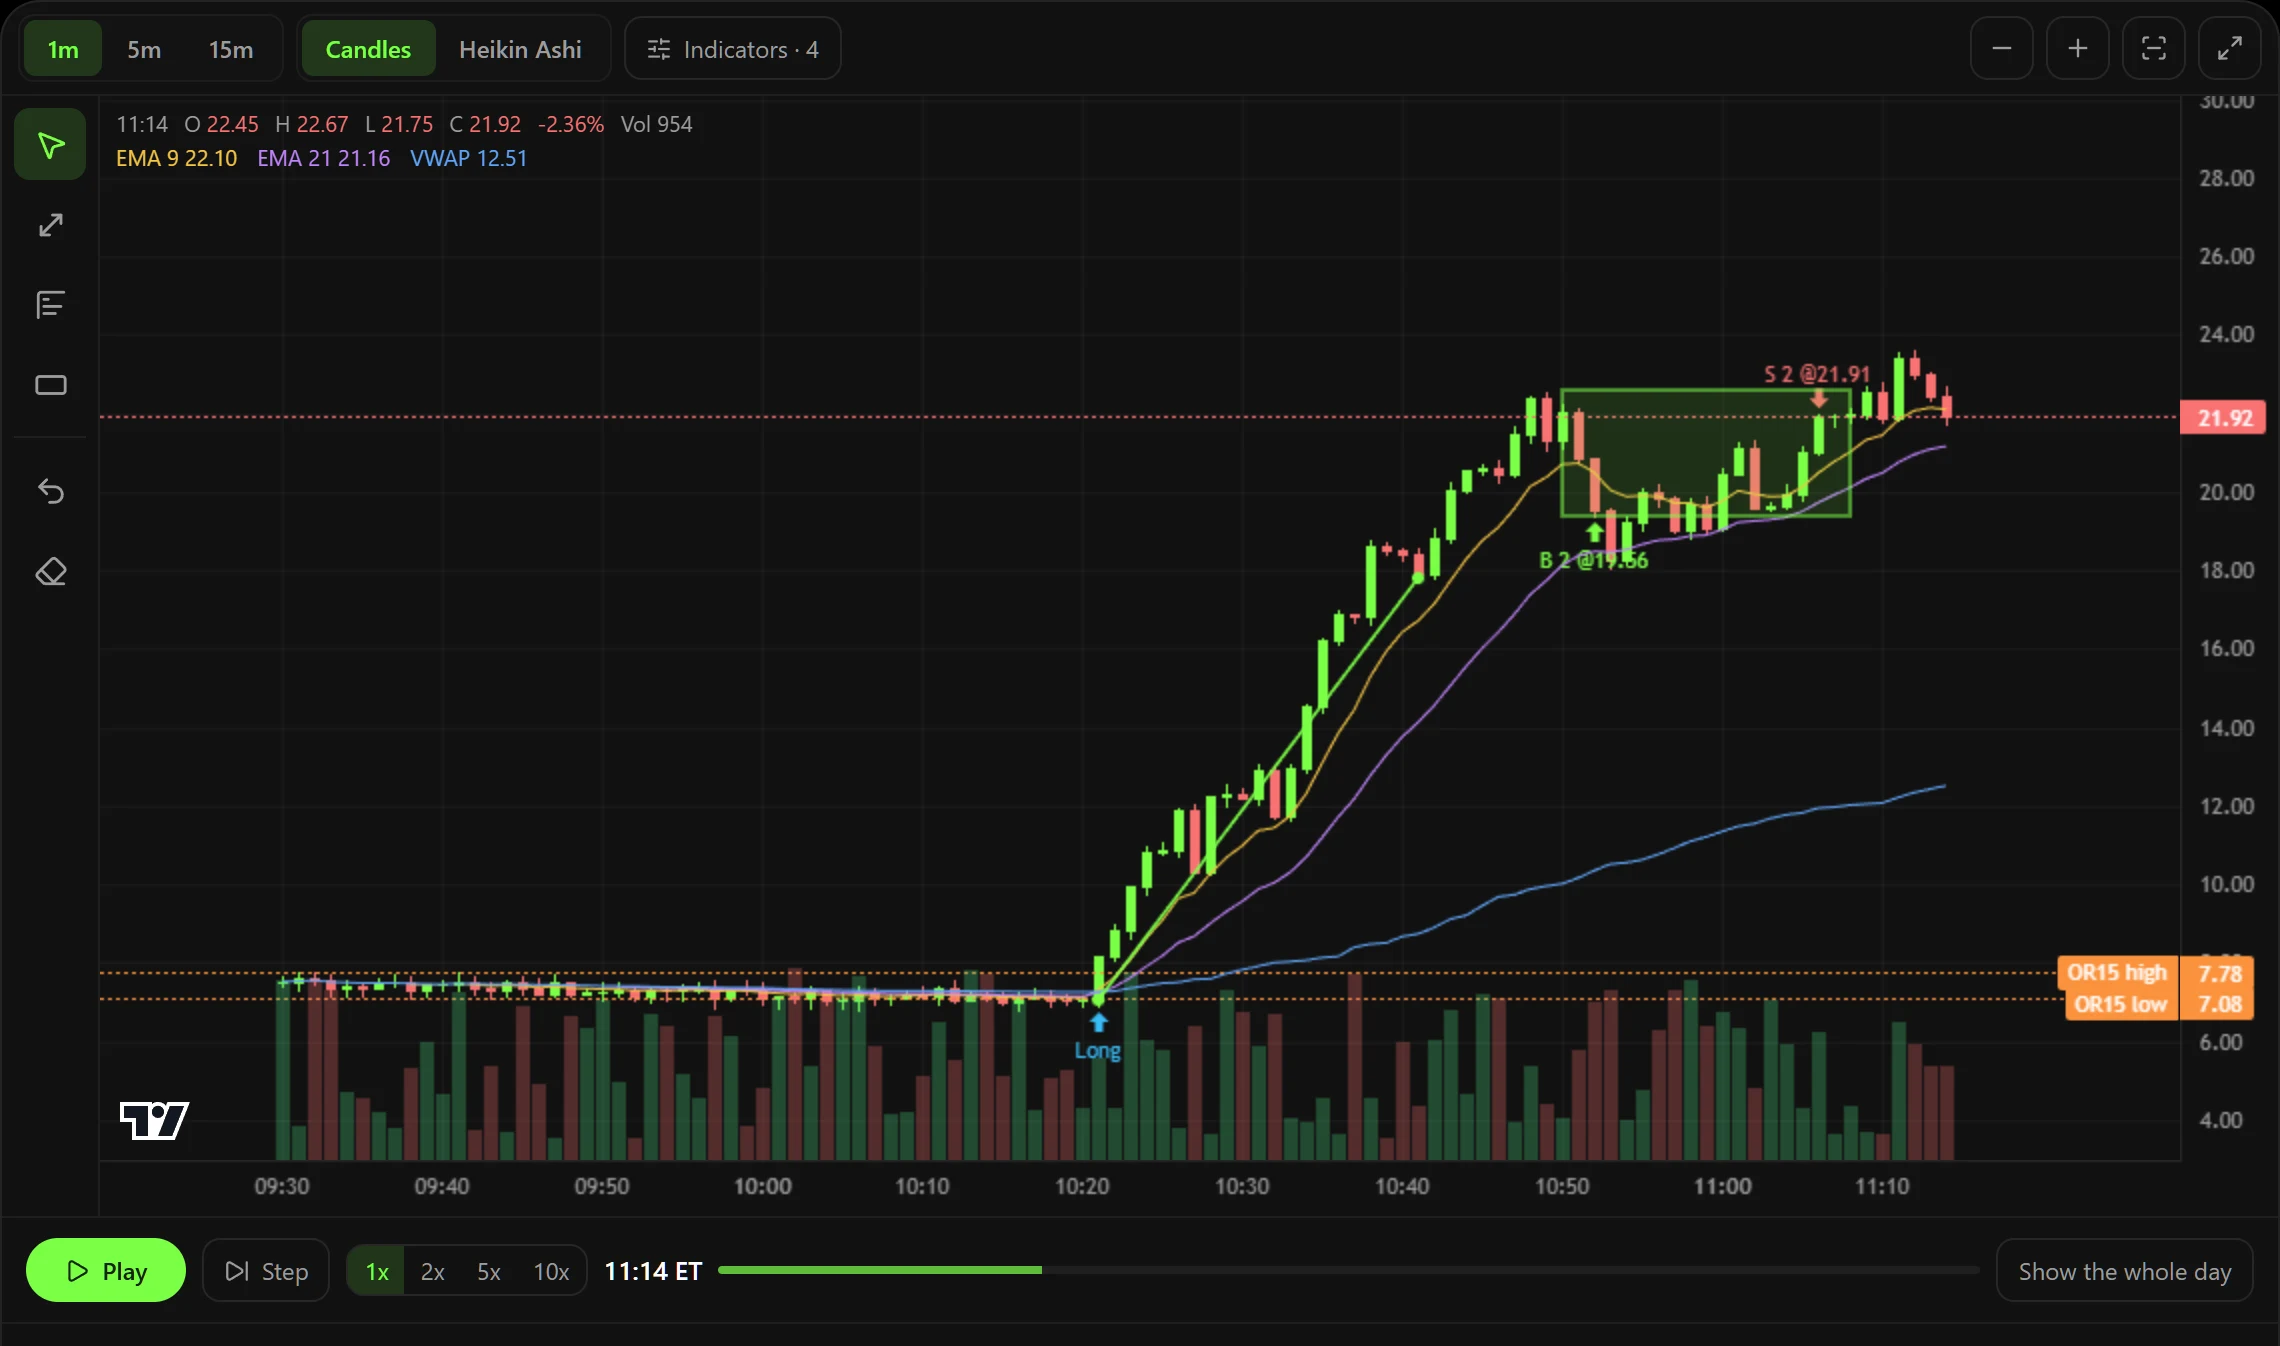
A real chart, not a slideshow
Minute bars for the exact contracts you traded, drawn on the open-source charting library from TradingView, with the tools you'd reach for on a live chart.
- The contracts you traded that day, plus any strike you pick
- The stock or ETF under them on its own chart
- 1, 5 and 15-minute candles, or Heikin Ashi
- Zoom, fit the whole session, and full screen
- Play at 1× to 10×, step one candle at a time, or click a candle to start there
Indicators
EMA, SMA, Bollinger Bands, VWAP, opening range, RSI and MACD. Standard settings to start, yours to change, and each value in the legend as the crosshair moves.
Drawing tools
Trend lines, horizontal levels and zones, with undo. They stay on that contract's chart for that day, so the levels you marked are there when you come back.
Take the trade again
Buy, sell and close as the session plays, with open and closed P&L as you go. Practice orders fill at the close of the candle on screen, carry no commission, and never touch your journal.
Test a rule on the day
Run an EMA crossover, opening range breakout or VWAP cross over the session, long only or both ways, and see the net, win rate and largest drawdown with every entry marked on the chart. It only sees the candles the replay has shown. It tests a rule on one past day; it never tells you what to trade next.
Where the data comes from
The trading day after
One-minute bars from OPRA, the options tape, and the US stock exchanges. A session opens for replay the trading day after it closes. That is the license that keeps it affordable: same-day options data carries the exchanges’ real-time fees.
Indexes drawn as their ETFs
Index values carry their own license, so SPX is drawn as SPY, NDX as QQQ and RUT as IWM. Only the chart underneath changes: the SPX options you traded keep their real prices.
Fill times, when your broker has none
Schwab sends the day of a trade but not the minute. For those trades the chart shades the candles your fill price traded through, labeled as an estimate, rather than inventing a time.
Included on Diamond
$39 a month, and the first 7 days are free.